More London homes are selling for less than the owner paid
The share of London resales going below the purchase price rose from 9.7% to 13.9% in a year, and flats make up 89% of them. Flats bought new in 2020–22 are the hardest hit: 71% of those resold this year went for less than the owner paid.
About these figures. The headline numbers, the trend chart and the two comparison charts cover homes resold in January–June (2025 and 2026). The purchase-year and borough charts cover homes resold in the 12 months August 2025 – July 2026. All figures are fixed as of 6 October 2026.
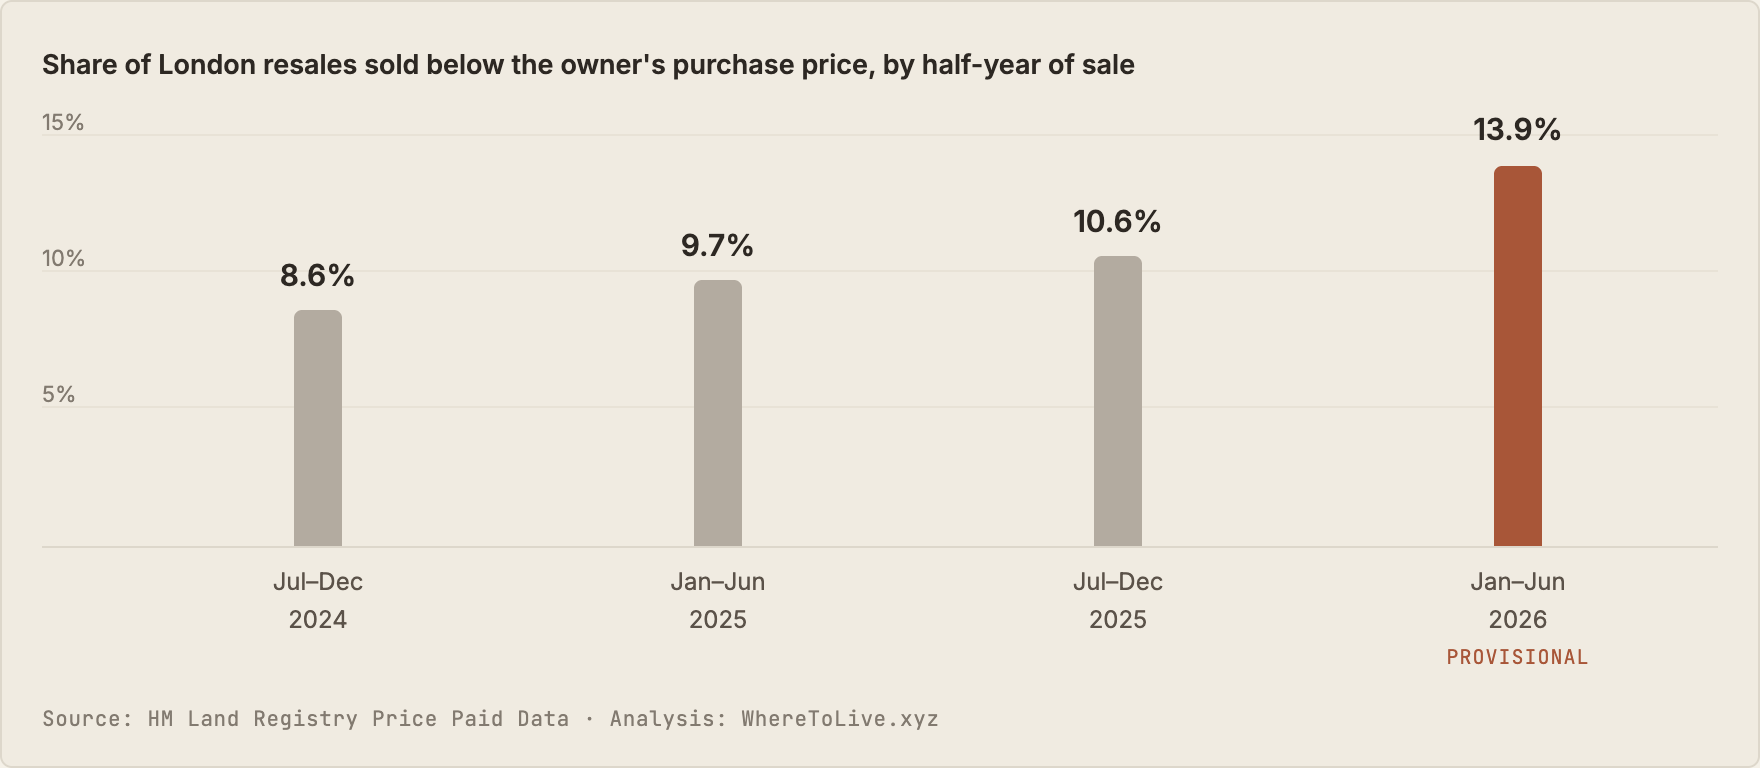
Up every half-year since 2024
13.9% of London resales in January–June 2026 went for less than the owner paid, against 9.7% a year earlier and 8.6% in the second half of 2024. The 2026 figure is provisional, but the rise is far larger than the revisions late registrations have produced.
2024
2025
2025
2026provisional
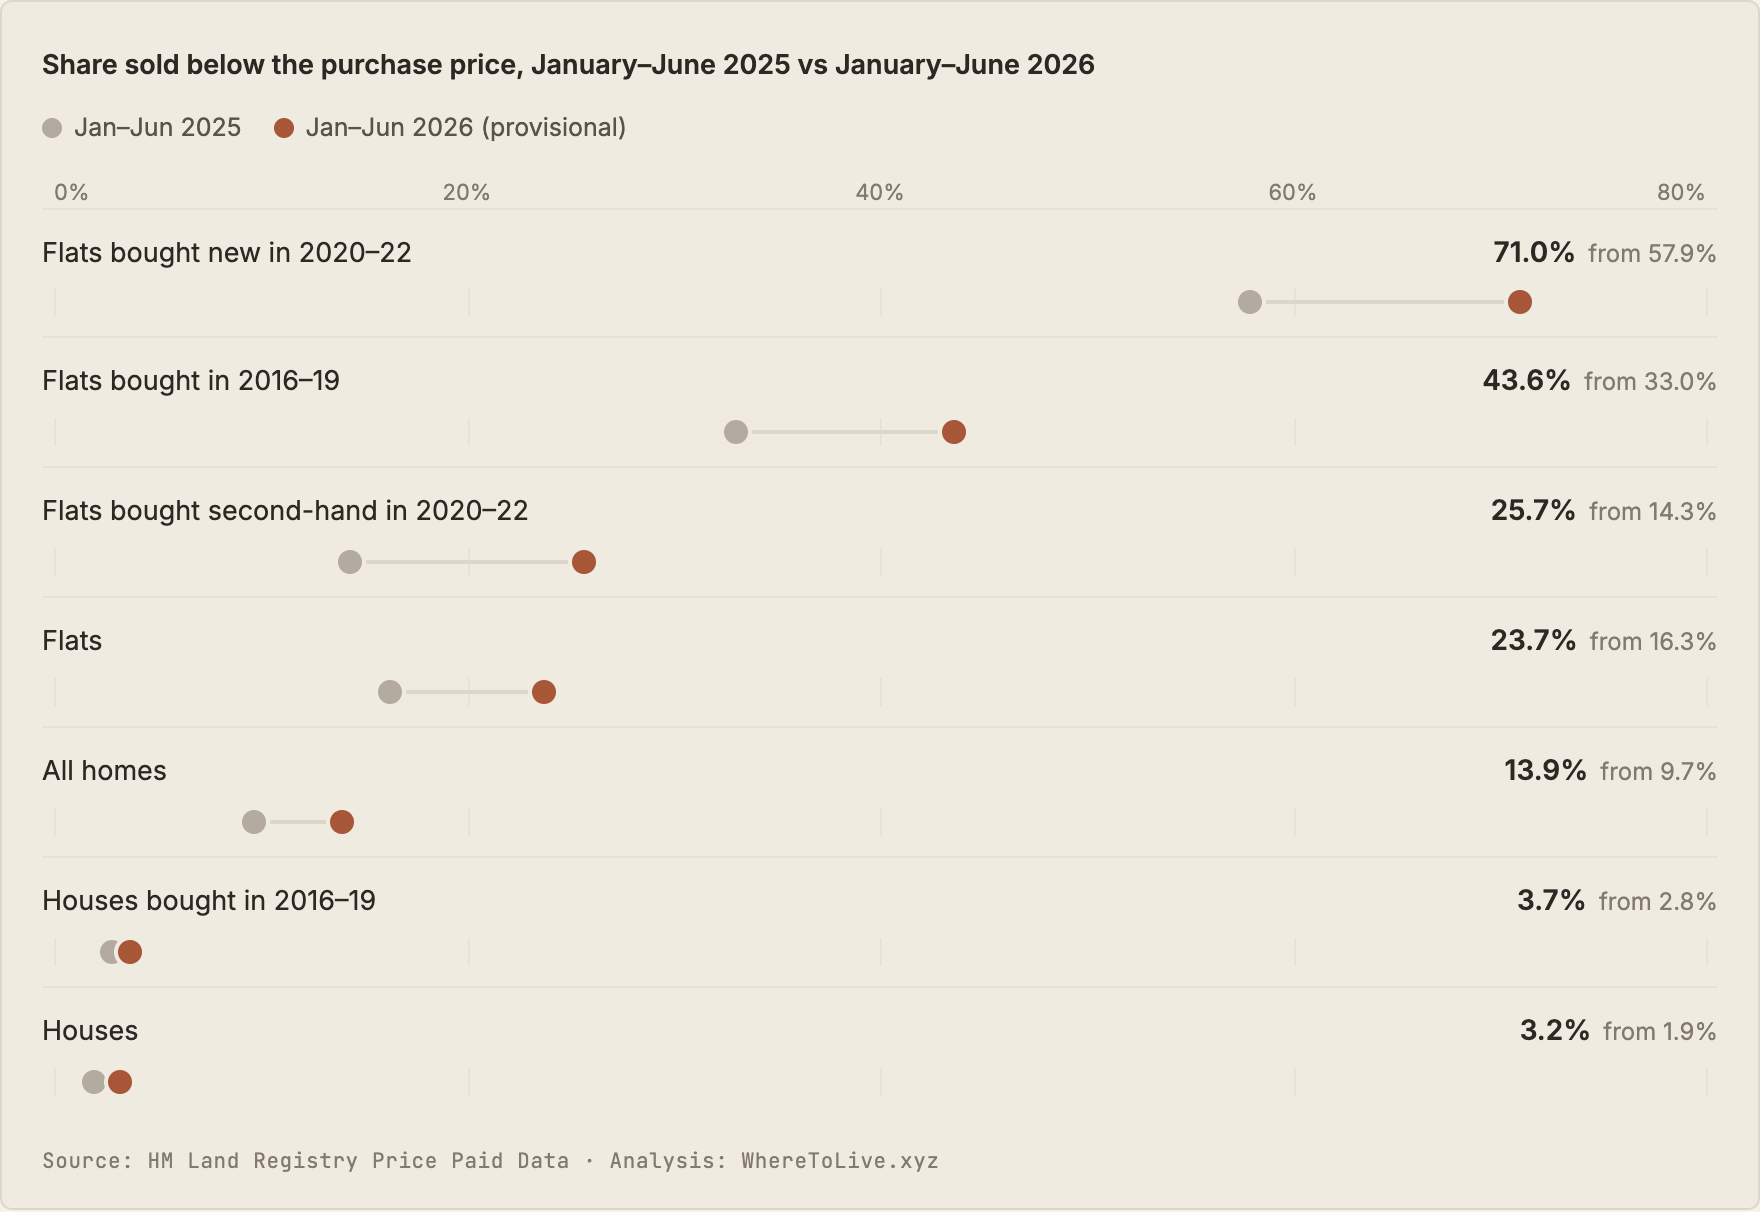
Every group is higher than a year ago
Flats bought new in 2020–22 rose from 57.9% to 71.0%, and flats bought second-hand in the same years from 14.3% to 25.7%. Houses moved least: 1.9% to 3.2%.
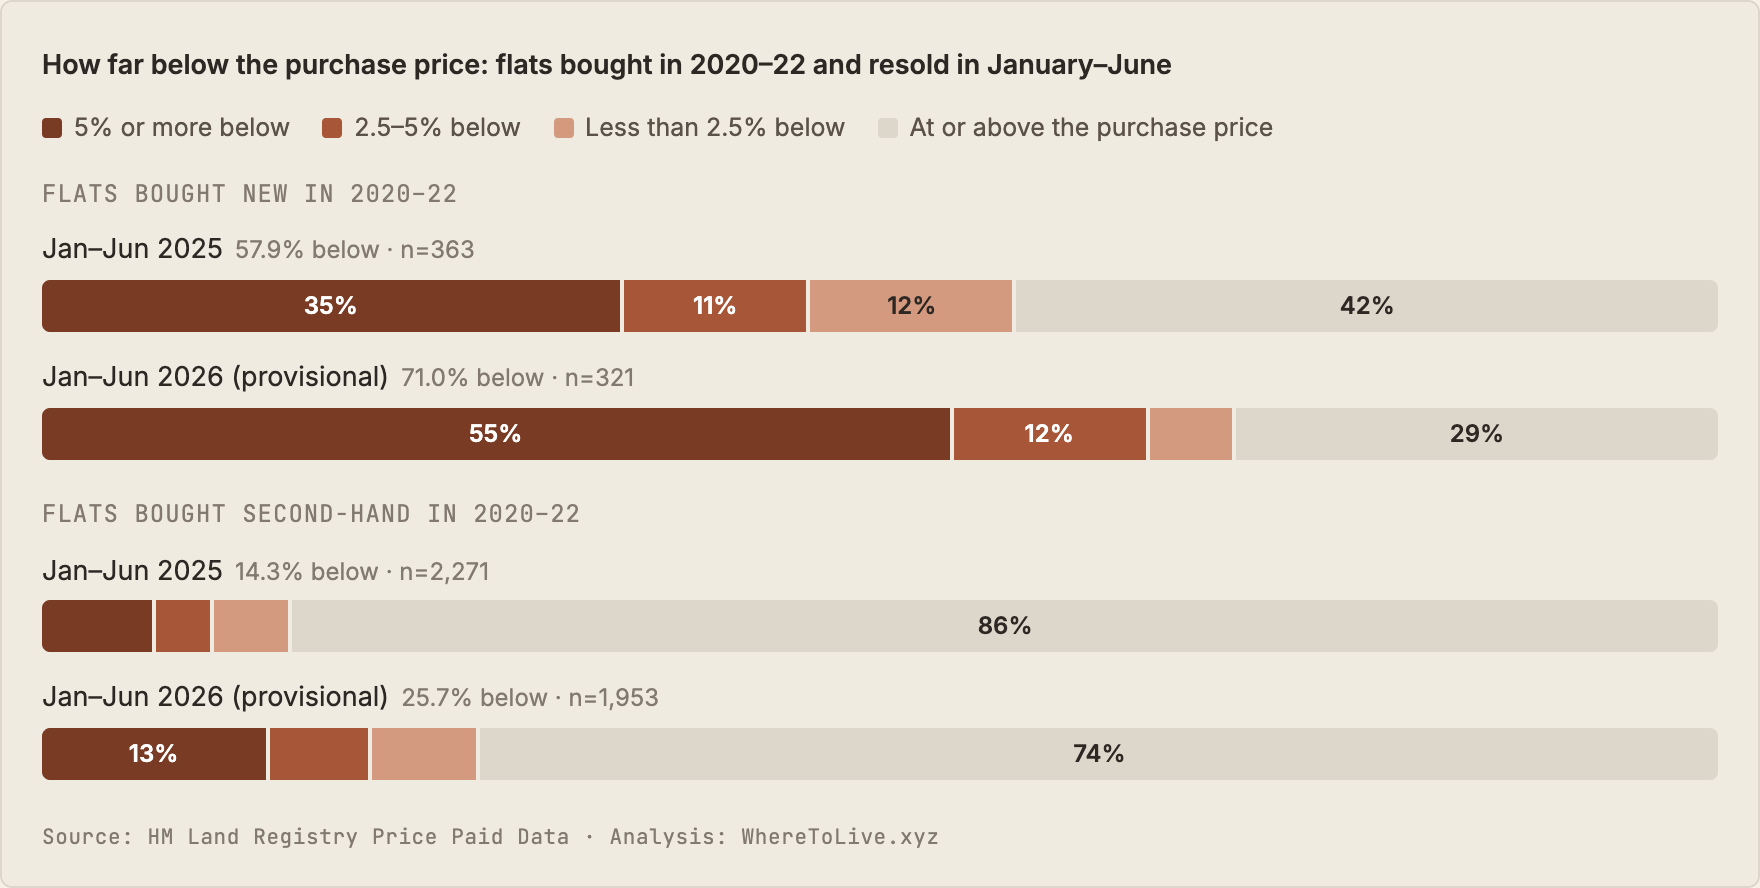
Most of those sales were well below the purchase price
Of flats bought new in 2020–22 and resold in January–June 2026, 66.0% sold for at least 2.5% less than the purchase price and 54.5% for at least 5% less; among those that sold below, the typical shortfall was £50,000. For flats bought second-hand in the same years the figures were 19.4%, 13.4% and £22,000.
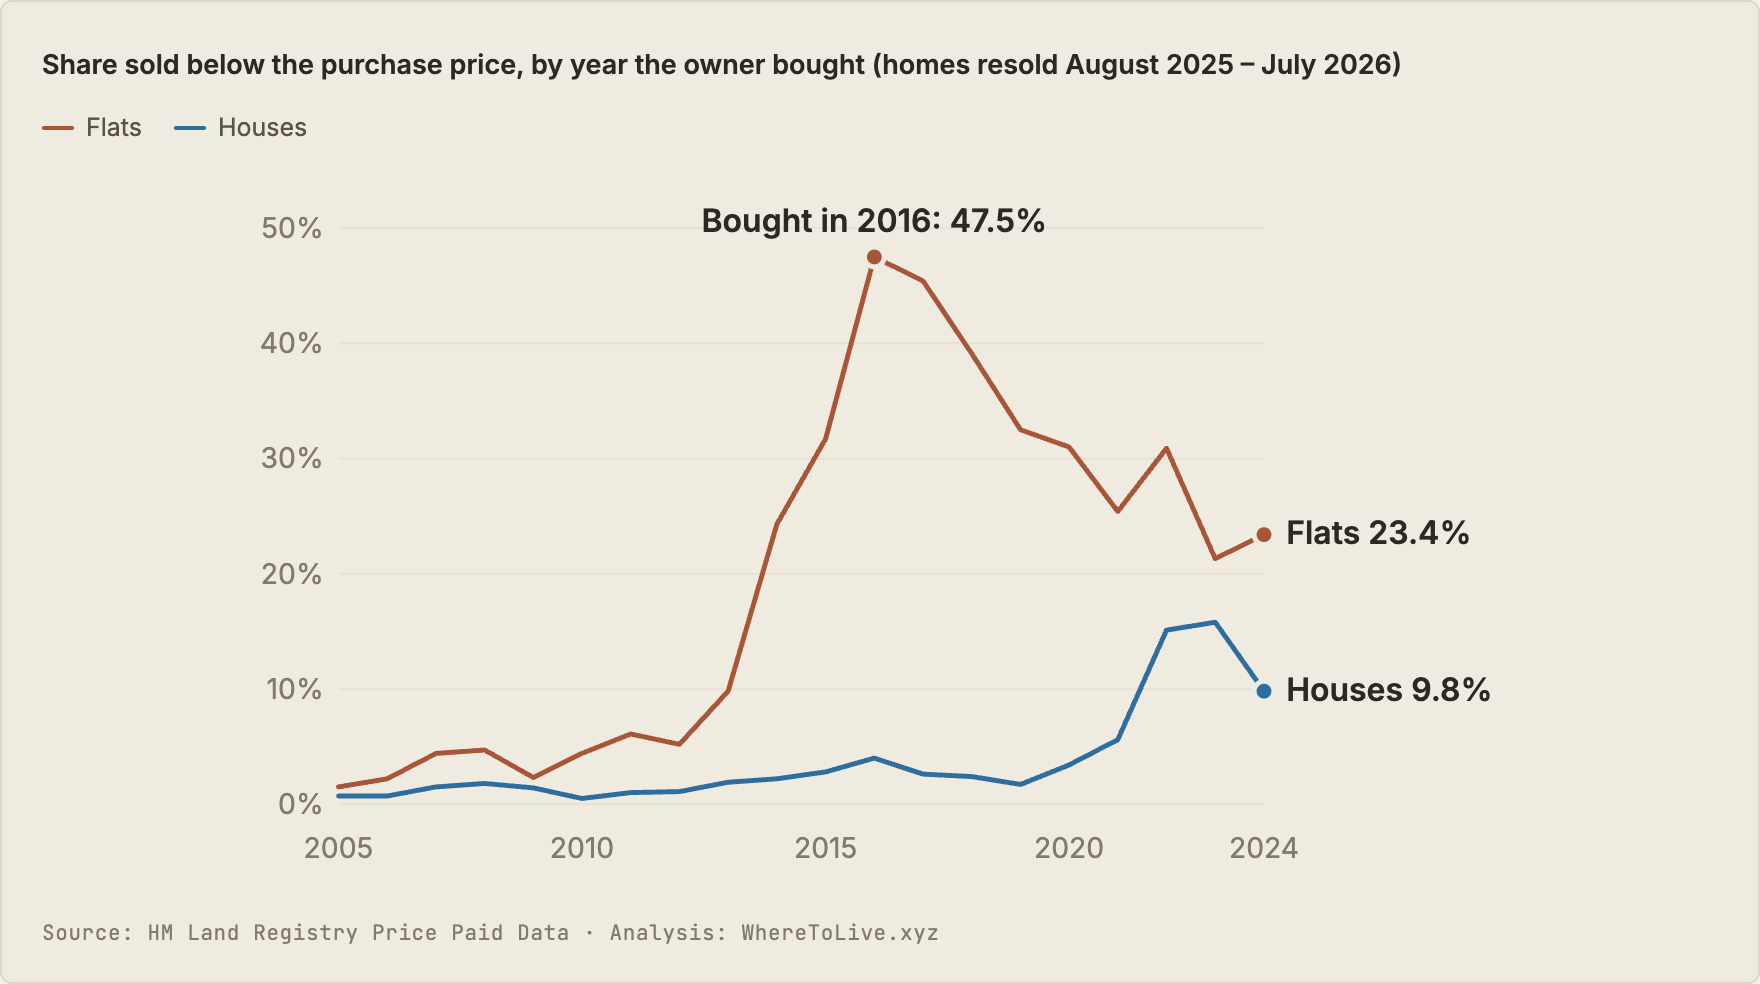
By purchase year, flats bought around 2016 fare worst
Of homes resold in the 12 months to July 2026, 47.5% of flats bought in 2016 sold for less than the owner paid; for houses bought that year it was 4.0%. Flats bought before 2014 stayed under 10% in every purchase year.
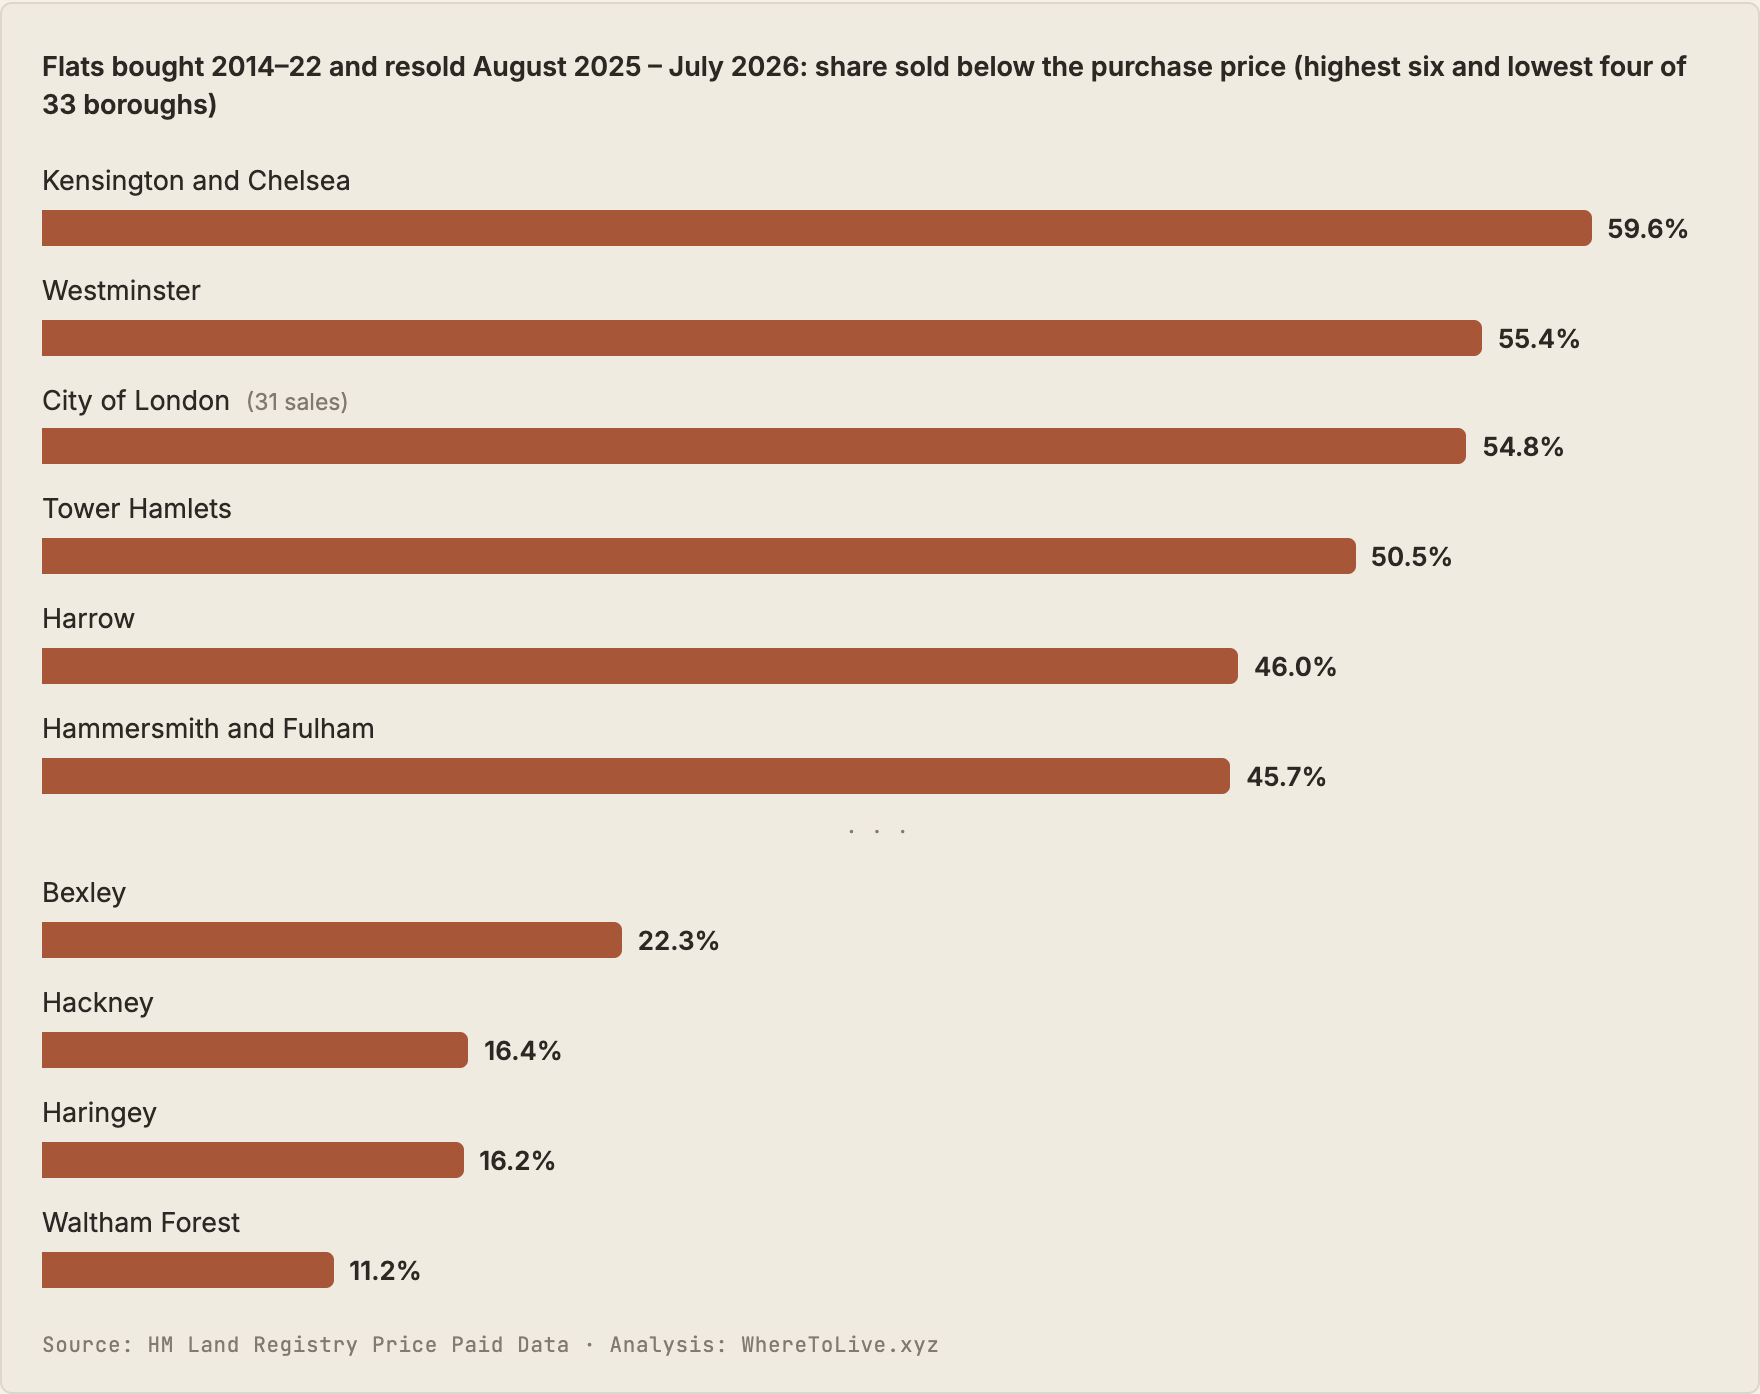
Prime central London highest, Waltham Forest lowest
In Kensington and Chelsea, 59.6% of flats bought in 2014–22 and resold in the past year went below the purchase price; in Waltham Forest, 11.2%. Tower Hamlets, with 786 such sales, was at 50.5%.
Context
2020–22 were the last years of the Help to Buy equity loan for new-build homes in England (closed to applications on 31 October 2022). Land Registry's price paid data does not show who used it. Homes England's own figures for England point the same way: of Help to Buy flats fully redeemed or sold in 2024/25, 45% were below the initial purchase price on redemption or sale, against 3% of houses (FOI RFI5206, June 2025). On 26 September 2026 the government announced "Your First Home" for first-time buyers of new-build homes, with details due at the Budget in October. We publish the numbers and take no policy position.
How our figure compares with Hamptons'
Hamptons put 2025 at 14.8%; our method gives 10.1% for 2025. We compare every resale with the home's previous sale however long ago, including homes held for decades, which rarely sell below what was paid; that explains part of the gap. Both find about nine in ten such sales are flats. Borough figures also differ because our borough chart covers flats bought in 2014–22 (59.6% in Kensington and Chelsea), while Hamptons' 22.4% for that borough covers all sellers in 2025.
- 2026 is provisional. Land Registry is still registering these sales (32,907 so far for January–June 2026, against 55,214 a year earlier). Re-tested after a later batch, January–March 2026 moved from 13.5% to 13.1%.
- Nominal prices. No adjustment for inflation, costs or improvements.
- Only homes that sold, not all owners.
- Not negative equity — we don't see mortgages.
- Like for like: both sales standard-price (category A), same property type; pairs where the resale price is under 0.6× or over 10× the purchase price, and ambiguous flat addresses, removed. Land Registry's category B (which includes repossessions, buy-to-let purchases it can identify from a mortgage, and transfers to companies and other non-private buyers) is excluded. "Bought new" = Land Registry new-build flag on the purchase.
Figures fixed as of 6 October 2026. Live version, recomputed as Land Registry data arrives: wheretolive.xyz/data/sold-below-purchase-price · live CSV · the figures in this note (CSV, fixed 6 Oct 2026)
The numbers behind the charts
| Jan–Jun 2025 | Jan–Jun 2026 (provisional) | Median sale vs purchase price, Jan–Jun 2026 | |
|---|---|---|---|
| All homes | 9.7% · 2,614 of 27,013 | 13.9% · 2,810 of 20,179 | +32.3% |
| Flats | 16.3% · 2,385 of 14,672 | 23.7% · 2,502 of 10,545 | +13.1% |
| Houses | 1.9% · 229 of 12,341 | 3.2% · 308 of 9,634 | +69.6% |
| Flats bought in 2016–19 | 33.0% · 1,295 of 3,921 | 43.6% · 1,161 of 2,662 | +1.4% |
| Houses bought in 2016–19 | 2.8% · 70 of 2,460 | 3.7% · 70 of 1,892 | +23.9% |
| Flats bought new in 2020–22 | 57.9% · 210 of 363 | 71.0% · 228 of 321 | −6.2% |
| Flats bought second-hand in 2020–22 | 14.3% · 325 of 2,271 | 25.7% · 501 of 1,953 | +5.3% |
About WhereToLive.xyz. An independent London property data project founded by Troy Tang. Data Notes are computed in code from HM Land Registry's published records and checked by hand before publication.
Media enquiries: Troy Tang, Founder · [email protected] · wheretolive.xyz/press